Understanding Brownfields Cleanup Costs

Motivation
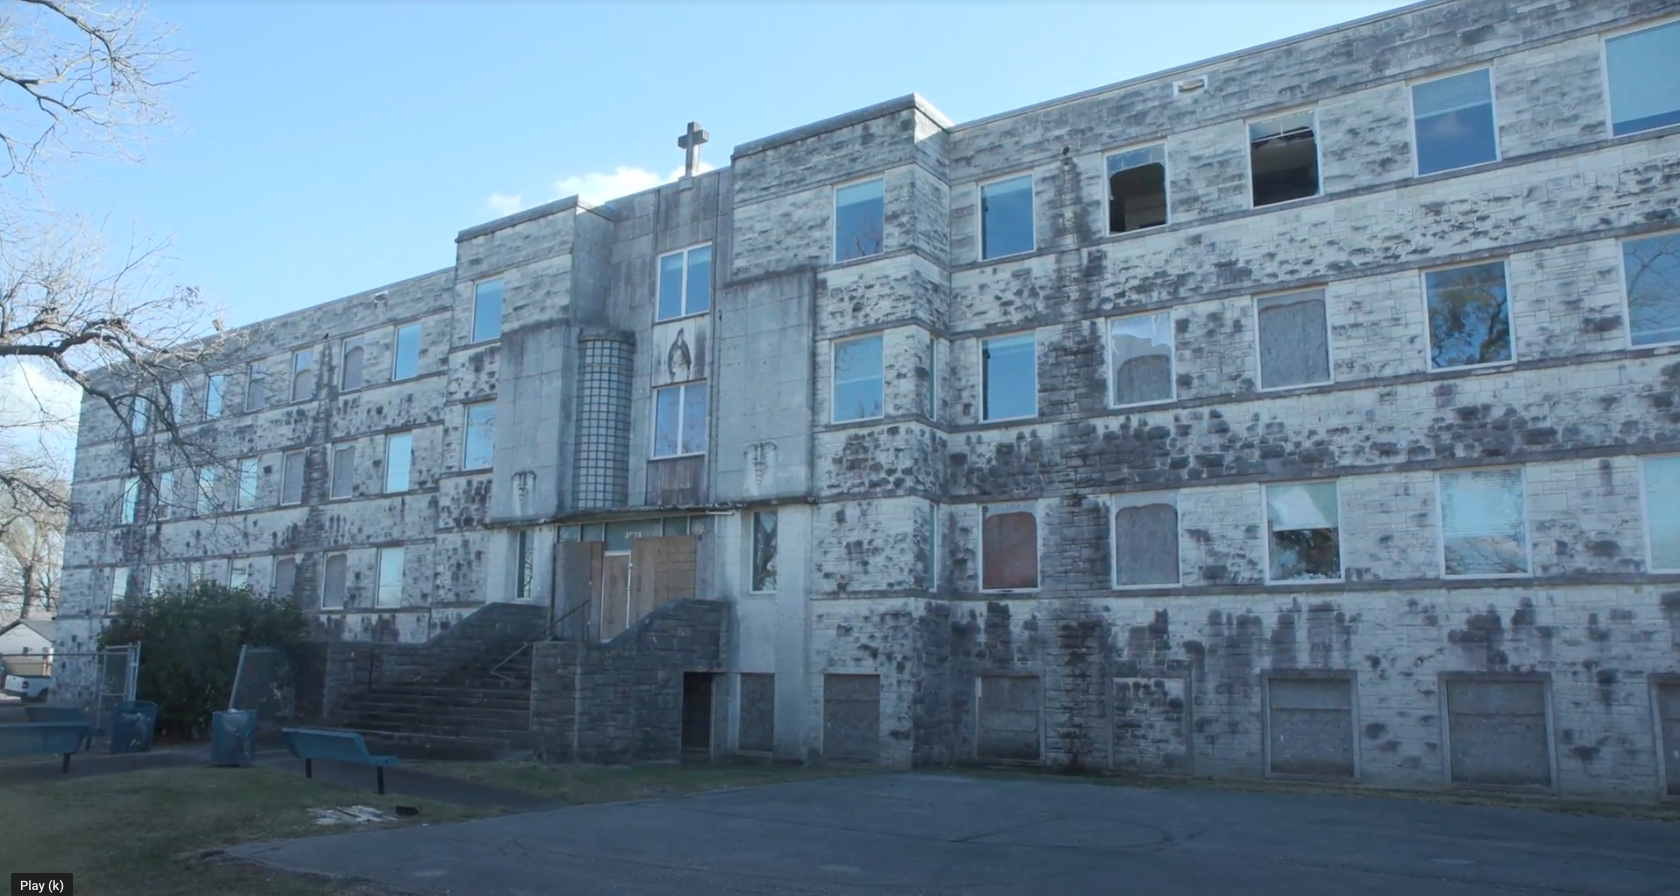
Rehabilitating underutilized properties in underserved communities can stimulate economic growth and quality of life improvements; however, with the potential high cost and liability for cleanup due to unknown environmental conditions, these properties (known as “brownfields”) can deter investment and exacerbate the decay of a neighborhood. Redevelopment of contaminated properties not only eliminates exposure to toxic chemicals in vulnerable populations, but the reuse of these properties presents unique opportunities to catalyze the revitalization of underserved communities.
If the cost of investigation and cleanup of a property is understood early in planning process, communities can design risk-based strategies, secure appropriate funding, and accelerate redevelopment of these sites. Furthermore, this understanding can enhance the ability for community organizations to control redevelopment in their neighborhood, preserve cultural integrity, and combat gentrification.
Insights From 25 years of EPA Brownfields Data
Site Specific Influences on Cost
Cleanup costs increase with the size of the property
Manufacturing facilities, rail and junk yards, and industrial sites are the most expensive to clean up
Residential and commercial buildings are the least expensive to clean up
Location-Based Costs
Cost varies dramatically by state, with cleanups costing the most in NY, CT, MA, and CA
Variability likely driven by differing state regulations and/or population densities (median cleanup cost in urban areas [$158k] >10x rural [$14k])
Cost by Contaminants and Media Affected
Cleanup cost increases with number of contaminants found
Organic compounds are the most expensive to clean up, metals are midrange, and asbestos is the least expensive
Contaminants in surface water and sediments are the most expensive to remediate; air and building materials are the least expensive
Data and Methodology
In 1995, the United States Environmental Protection Agency (EPA) created its Brownfields and Land Revitalization Program to empower states, tribes, communities, and other stakeholders to work together to prevent, assess, safely clean up, and sustainably reuse brownfields. Since the program’s inception, grant recipients have been reporting information on brownfields activities and environmental findings, as well as property information using the Assessment, Cleanup and Redevelopment Exchange System (ACRES). Here we analyze the entire 25-year history of the ACRES database to better understand what factors influence the cost of brownfields cleanup.
To enable cost comparisons between years, all cleanup costs have been normalized to 2020 USD using the consumer price index for cities based on the project completion year. There is a large variance in all the cost breakdowns presented; as such, we present median values in these plots. For the bar charts, only categories with 50 or more cleanup sites are included.


